
















































Zoho Analytics Turn Business Data Into Clear Decisions
Bring relevant data together in dashboards people can use. We configure Zoho Analytics around your business questions, with agreed measures and checks on the figures in each report.
We connect data sources and define useful reporting views, give teams a clear basis for interpreting the information, and help managers understand the decisions it needs to support.
✓ Implementation & improvement ✓ UK-based senior consultants ✓ Free 30-minute consultation ✓ Clear scope & pricing before work begins
Why Business Reporting Becomes Hard to Trust
Reporting becomes difficult when each system differs. Teams rebuild spreadsheets and use competing definitions for the same sales, service or financial performance measure.
We align Analytics sources, measures and review checks. Agreed refresh times, joins and filters explain reported totals, giving your team a shared basis for business decisions.
Scattered Data
Sales, finance and operational data sit apart, forcing teams to rebuild reports from exports.
Conflicting Measures
Reports use different filters or definitions, making it difficult to explain why the figures disagree.
Unclear Freshness
Dashboards lack clear refresh expectations, leaving users unsure whether the information is current.
Weak Validation
Data joins and calculations are not checked against source records, allowing errors to distort the picture.
Three Ways We Work With Zoho Analytics
Create a new reporting foundation, improve existing dashboards or connect additional sources. We agree business questions and validation requirements before building the solution.

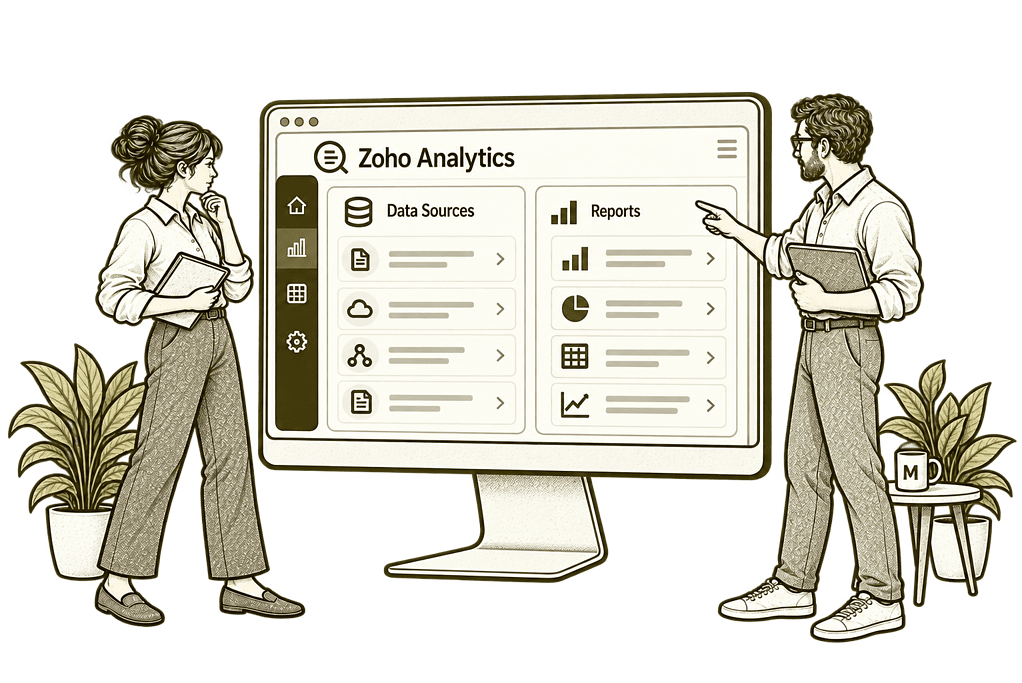
New Zoho Analytics Implementation

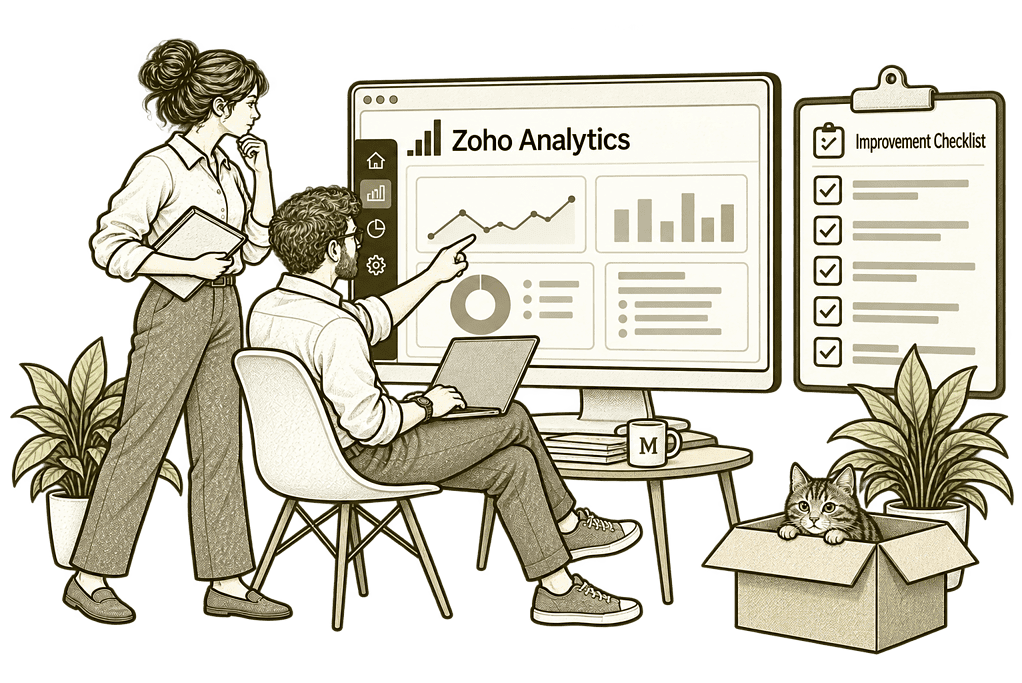
Improve Existing Zoho Analytics

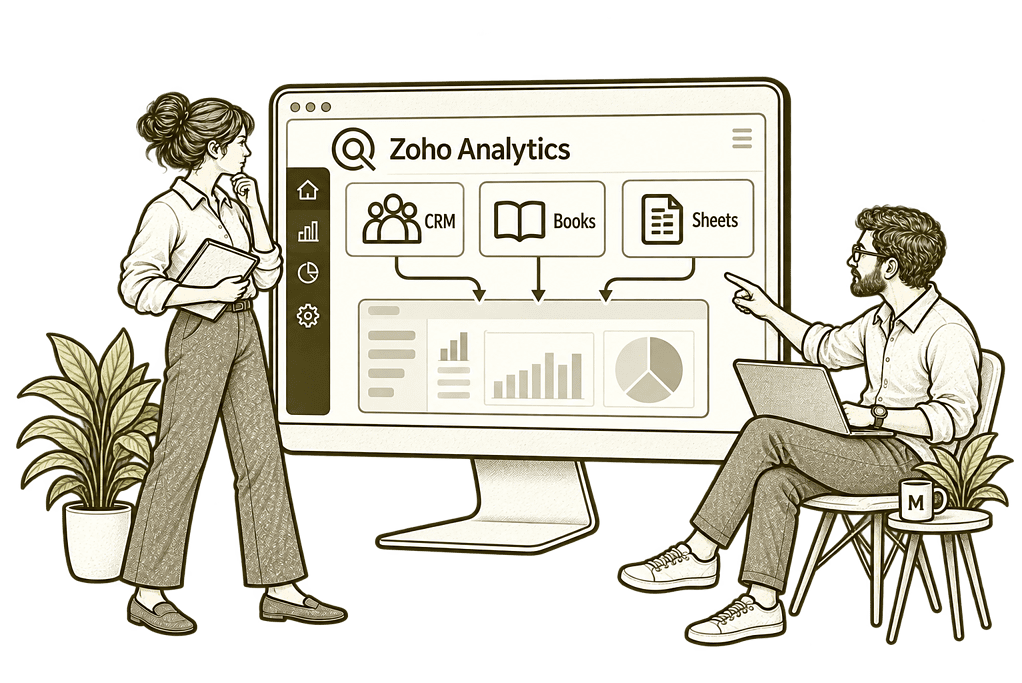
Connect Business Data Sources
Analytics Built Around Your Business Questions
We start with the decisions your team needs to make. Sources, data models and measures are designed together, with connector capabilities, limits and sharing options checked against your plan.
Questions & Measures
Agree useful business questions and metric definitions so each report has a clear purpose.
Source Connections
Configure supported imports and refresh schedules with clear ownership and failure handling.
Data Preparation
Review formats, duplicates and missing values so reporting starts from understandable records.
Modelling & Joins
Define relationships and calculations with checks to prevent duplicate counting or incorrect comparisons.
Dashboards & Access
Build relevant views and permissions so users see the information appropriate to their responsibilities.
Validation & Training
Reconcile key figures and help users interpret filters, refresh times and reporting limitations.
One Clear Journey From Source Record to Decision
Data is collected from the agreed systems, prepared and combined using defined relationships. Measures are checked before dashboards help users understand what changed and where to investigate.
We configure that journey so the numbers remain connected to their sources, with clear definitions and refresh expectations.

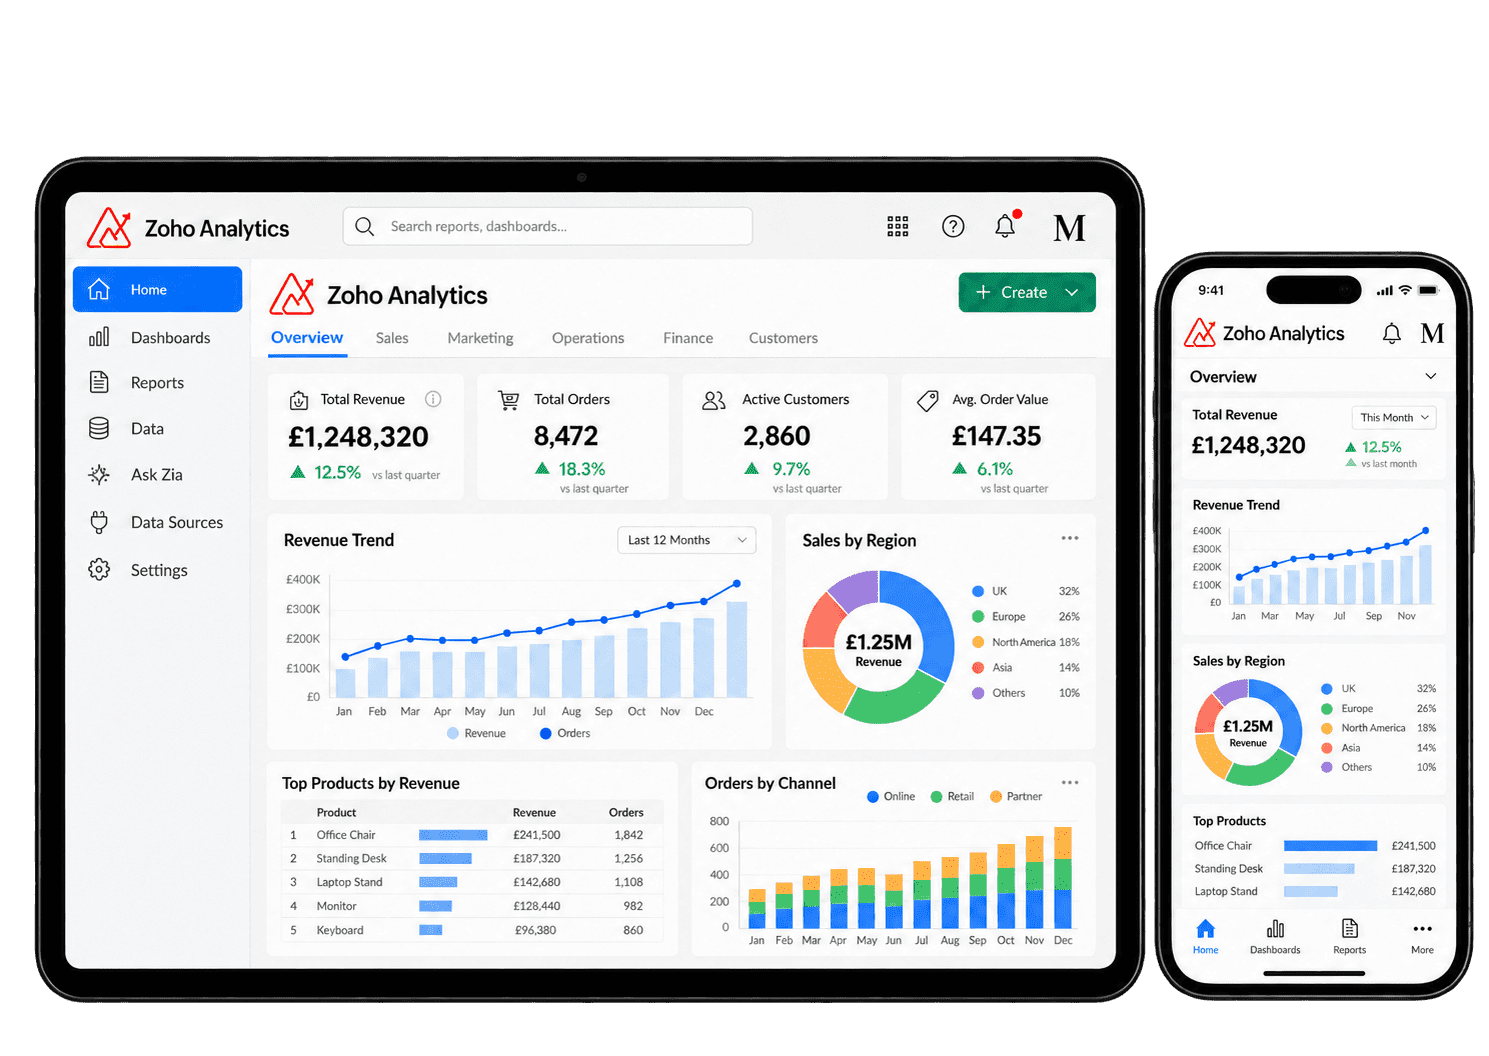
Make Reporting Repeatable and Explainable
Zoho Analytics supports data connections, modelling and dashboards. We configure the relevant capabilities and test the reporting process against representative records and business questions.
-
Business Questions
-
Data Connections
-
Data Preparation
-
Data Modelling
-
Metric Calculations
-
Dashboard Design
-
Sharing & Permissions
-
Refresh & Review
Define the decisions a report should support and the measures needed to answer them, so each dashboard gives its audience a useful business purpose.
- Agree users and decisions.
- Define measures and reporting periods.
- Record exclusions and interpretation rules.
For example, a director wants to know which sales opportunities need attention this week. We agree the stages, date range and decisions the dashboard should support before building it. Each view is checked against sample opportunities and the team's normal review.
Bring relevant records into a reporting workspace through supported connections, with fields, source ownership and refresh behaviour checked before combined figures are used.
- Assess supported connectors and imports.
- Agree required fields and access.
- Test refresh and failure behaviour.
For example, a report needs customer activity from CRM alongside invoices from finance. We assess supported connections, required fields and refresh behaviour with the source owners. We test a failed refresh and confirm which system owns each field.
Prepare records for useful analysis, with missing details, inconsistent values and duplicate handling checked against rules approved by the data owners.
- Review missing values and duplicates.
- Agree formats and transformation rules.
- Check sample results with source owners.
For example, imported records use inconsistent service names and contain missing customer references. We agree preparation rules with the source owners and test the resulting records before including them in reports. Unresolved references stay visible for correction or an agreed exclusion.
Connect datasets through agreed relationships and keys, checking how records relate so combined figures avoid repeated counting and keep useful context.
- Agree keys and table relationships.
- Check record grain and join behaviour.
- Test unmatched and repeated records.
For example, a customer has several opportunities and several invoices. Joining those tables directly could multiply values and overstate the result. We define their record grain and relationships, then reconcile samples and totals with the business owner.
Build calculations around approved definitions, checking dates, currencies and exclusions so report owners can explain a measure and reconcile its result to source records.
- Document formulas and filters.
- Check dates, currencies and exclusions.
- Reconcile results against source records.
For example, finance and sales use different meanings for revenue. We agree whether a measure refers to booked, invoiced or received amounts, including currency and period rules. A sample calculation is reconciled to the underlying transactions.
Present the information each audience needs in practical views, with clear filters and dates so managers can identify changes, investigate issues and assign the next action.
- Agree layout and user questions.
- Configure appropriate charts and filters.
- Test interpretation with representative users.
For example, a delivery manager needs to see overdue work and the teams responsible. We organise the dashboard around those questions, with useful filters and clear dates rather than unrelated charts. Representative users test the view using a normal weekly review.
Give each reporting audience appropriate access using the controls available in your plan. Check whether users can see individual records or only the summaries intended for their roles, and review sharing permissions when responsibilities change.
- Assess available sharing controls.
- Agree user and data permissions.
- Test restricted views and export behaviour.
For example, department managers need their own performance views while leadership needs a wider picture. We assess supported sharing and data controls, then test representative users and export behaviour before release. We also check a user who should have no access to another department's records.
Keep dashboards within a managed reporting routine, with clear refresh expectations, reconciliation checks and named owners for issues affecting figures.
- Document refresh expectations.
- Agree monitoring and reconciliation checks.
- Assign issue and change ownership.
For example, a source refresh fails before the monthly review. We agree who investigates, how users recognise the last successful update and when reconciliation must occur. The meeting uses a clearly dated result or waits for a checked refresh.
Reporting That Keeps the Business Context
We agree the questions, definitions and validation behind each view. Financial and operational measures use the appropriate source and timing; forecasts and AI-generated interpretations require review.
Sales Performance
Review agreed sales measures with clear stage definitions, date filters and source-record checks.
Finance Views
Compare relevant financial figures using approved definitions and reconciliation to accounting records.
Marketing Outcomes
Assess source and campaign measures with explicit attribution rules and data-quality limitations.
Delivery Progress
Review operational or project measures using consistent statuses, dates and completion definitions.
Customer Trends
Explore recorded customer activity with appropriate time periods, access controls and interpretation.
Data Freshness
Review source refresh expectations and exceptions so users understand the timing of the figures.
Data Quality
Identify missing or inconsistent records that affect measures and assign responsibility for correction.
AI-Assisted Analysis
Assess available Ask Zia capabilities with approved data access and human checks of generated results.
Connect Reporting Across the Business
Useful analysis often combines relevant sales, finance and delivery records. We scope connections with Zoho CRM, Zoho Books, Zoho Projects and the wider Zoho One ecosystem.
Website and external sources are assessed for supported connectors or import methods. We agree keys, definitions and refresh schedules rather than assuming separate datasets automatically combine into a reliable business view.

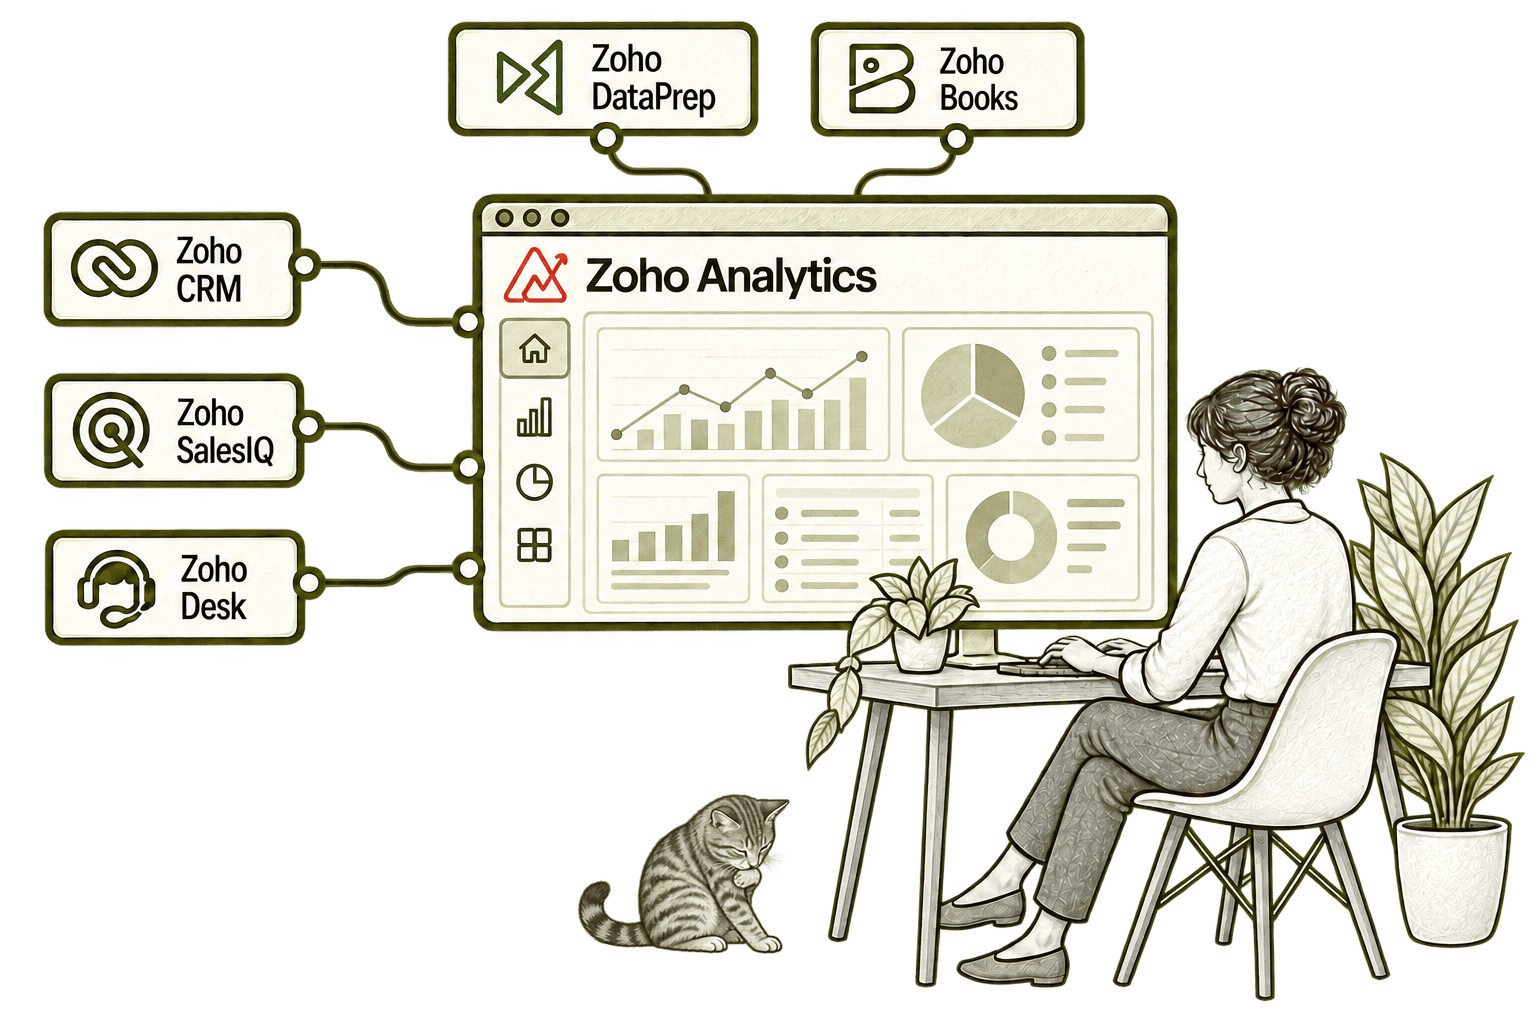
Sales records alone can hide wider performance patterns. Connecting CRM with Analytics brings agreed sales data into reports, helping managers examine the pipeline and investigate changes.
Chat totals alone can hide why visitors struggle. Connecting SalesIQ with Analytics brings engagement data into reports, helping the team examine patterns and improve the website support experience.
Ticket queues alone do not show longer-term service patterns. Connecting Desk with Analytics brings support data into reports, helping managers examine response times and recurring issues.
Inconsistent source data can make reports misleading. Connecting DataPrep with Analytics prepares and transfers agreed datasets, helping the team report from cleaner, more consistent information.
Accounting totals alone can hide useful trends. Connecting Books with Analytics brings finance data into reports, helping staff investigate performance and compare the figures.
Start With the Questions Your Business Needs Answered
Whether reports live in spreadsheets or an existing Analytics workspace, we begin with source ownership and the decisions the figures should support.
Starting Fresh
We agree priority questions, source records and definitions before configuring Analytics. The first release provides focused dashboards with documented checks.
Already Using Zoho Analytics
We review connectors, models, calculations and permissions. Improvements focus on conflicting figures, unclear refresh expectations and reports that are difficult to maintain.
A Clearer Starting Point
If reporting gaps start in source systems or wider business processes, we help establish what needs attention first.
Our Business Systems & Operations Audit can clarify the gaps and recommended priorities.
What a Zoho Analytics Engagement Includes
Discovery & Scope
Agree business questions, data sources and reporting priorities before defining the implementation scope.
Definitions & Model
Document measures, record relationships and refresh expectations with the relevant source owners.
Configuration & Reports
Configure supported connections and build the agreed data model and focused dashboards.
Validation & Access
Reconcile key results, test joins and confirm report permissions with representative users.
Training & Handover
Guide users through filters and interpretation and document reporting maintenance duties.
Review & Improvement
Review the working reports and prioritise changes based on decisions, feedback and data-quality findings.
Scope depends on source availability, data quality, reporting complexity and your plan. We agree deliverables before work begins; refresh latency, source limitations and AI or forecast assumptions are documented and reviewed.
Different Businesses. Different Reporting Questions.
Measures should reflect your operating model and the decisions your team needs to make. We adapt the reporting while keeping definitions and access controls clear.
Review relevant business and service measures while protecting confidential client and employee information.
Combine appropriate operational measures with clear definitions for delivery status, timing and exceptions.
Assess business reporting with specialist review of insurance measures and required information controls.
Recruitment & Workforce Agencies
Review recruitment measures using agreed vacancy, application and placement definitions and source checks.
Support relevant management reporting with approved financial definitions and appropriate governance.
Property & Housing Associations
Compare property-related measures using clear source relationships, reporting periods and agreed definitions.
Assess programme or organisational measures with explicit definitions and appropriate stakeholder access.
Review project and business measures while retaining specialist commercial and site reporting definitions.
Why Mason & Co
We consider Analytics as part of your wider data architecture. You work with senior consultants who assess source ownership, metric definitions and validation alongside dashboard configuration.
Senior-led consultancy
Work directly with senior consultants who understand your business process and technical delivery.
UK-based, international delivery
Work with our UK-based team across locations, with delivery planned around your working hours.
Architecture + implementation
Connect business design with practical configuration and integrations that support everyday work.
Zoho + AI + automation
Connect Zoho, AI and automation where they solve a clear problem and improve your daily processes.
Not Sure Whether Mason & Co Is the Right Fit?
Tell us what you want to implement, improve or fix. We will discuss whether we can help and recommend a sensible next step based on what you share.
Your Questions Answered
What is Zoho Analytics used for?
Zoho Analytics connects and analyses data through reports and dashboards. We configure relevant sources and measures around the business questions your team needs to answer.
Can you combine data from different systems?
We assess supported connections and define the relationships between records. Joining keys, record grain and duplicate handling are tested rather than assuming datasets blend correctly.
Will dashboards always show real-time figures?
Not necessarily. Freshness depends on the source, connector and refresh method. We document the expected timing and test update behaviour before agreeing how reports should be used.
Can you fix conflicting report numbers?
We investigate definitions, filters, source records and data-model behaviour, then reconcile agreed measures. Source-data issues may need correction in the owning system.
Can users see only appropriate information?
We assess available sharing and data-access controls and test representative users. Permissions and export behaviour are included in the reporting design.
Can AI answer questions about our data?
Available Ask Zia features can assist analysis. We assess plan availability, model settings and data access, and require review of generated calculations or interpretations before relying on them.
How do we get started?
Book a free consultation to discuss your sources and reporting challenges. We will help identify whether you need a new Analytics setup, dashboard improvements or a wider systems audit.
Which Business Questions Are Your Reports Failing to Answer?
Tell us which questions matter, where the data sits and who uses the answers. We will help define useful measures, reliable sources and a practical starting point for Zoho Analytics.
30 minutes. No charge. No obligation.